The easiest way to get this is to grab a GitHub action build of melonDS. You can find that [here](https://github.com/melonDS-emu/melonDS/actions). (Note: you'll need to be signed into a GitHub account to download these builds)
- The [GNU ARM Embedded Toolchain](https://developer.arm.com/downloads/-/gnu-rm) installed on your system - A Ghidra database of NSMB DS -Eventually, NSMB Central will host a shared Ghidra project so we have one centralized project anyone can contribute to. For now, you can generate a Ghidra project using [this tool](https://github.com/Ed-1T/NDS-Decompilation-Project-Maker/releases/tag/v1.2 "The GitHub page for the NDS Decompilation Project Maker"). If you need help, please ask in our Discord!
#### Configuring melonDS To enable the GDB, you need to do the following: 1. Click on the **Config** menu at the top of the emulator, then click on **Emu Settings** 2. Click on the **Devtools** tab 3. Check Enable **GDB stub** 4.If you do not see the Devtools tab, then you have not built melonDS with GDB enabled. Please check the link at the start of the guide to find a download with GDB enabled or build it yourself enabling GDB in CMake
melonDS is ready to go!
#### Setting up Ghidra To begin, open your Ghidra project in the code viewer as you normally would. 1. Click on File -> Configure, which should open a list of tools 2. Check the "Debugger" box [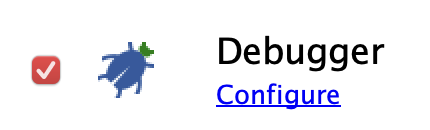](https://bookstack.nsmbcentral.net/uploads/images/gallery/2024-04/image.png) This should cause windows to appear in your current project, likely making the following steps redundant. If you are unable to find a window, the following steps will either open the window, or present it to you in the project. #### Creating a Debugger TargetThis method has been tested on Linux and macOS. You should be able to follow these steps using WSL on Windows. Follow [this guide](https://learn.microsoft.com/en-us/windows/wsl/install "Microsoft Tutorial for WSL") if you need help setting up WSL.
To begin, open the Debugger Targets window by navigating to Windows -> Debugger -> Debugger Targets. The window should look something like this: [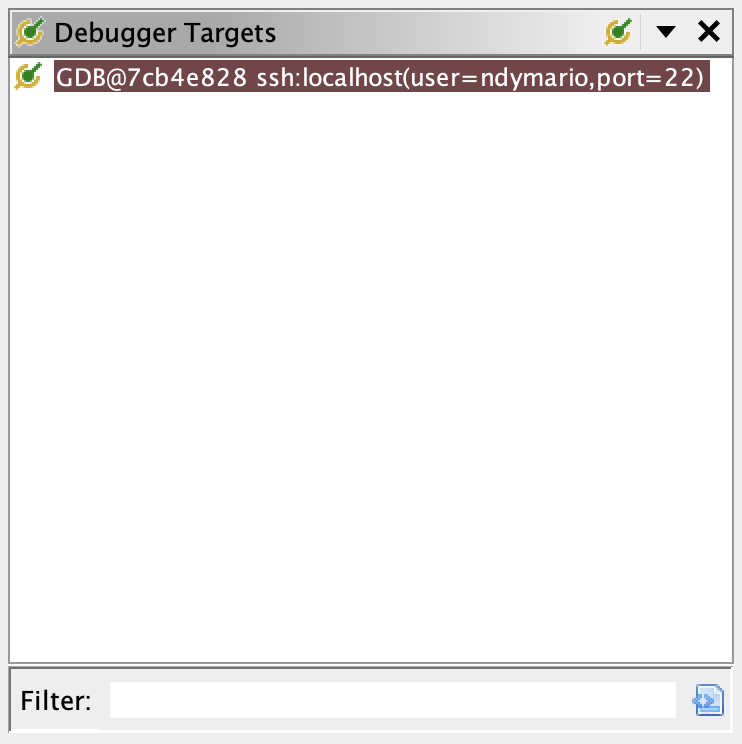](https://bookstack.nsmbcentral.net/uploads/images/gallery/2024-04/gjbimage.png)As you'll notice, there is an active connection in the screenshot but nothing on your end...let's fix that! Click on the [](https://bookstack.nsmbcentral.net/uploads/images/gallery/2024-04/ci5image.png) button to open the **connect** window. ##### If you are on Linux: - Choose **gdb** in the dropdown - Set **arm-none-eabi-gdb -ex "set arch armv5t"** as the **GDB Launch Command** -If you have not added arm-none-eabi-gdb to your PATH, you'll need to provide the absolute path
- Click [](https://bookstack.nsmbcentral.net/uploads/images/gallery/2024-04/Z1Gimage.png) ##### If you are on macOS - Choose **gdb via SSH** in the dropdown - Set **arm-none-eabi-gdb -ex "set arch armv5t"** as the **GDB Launch Command** -If you have not added arm-none-eabi-gdb to your PATH, you'll need to provide the absolute path
- Set **SSH hostname** to **localhost** - Set **SSH username** to your username -You can use the command **whoami** in the terminal to get your username if you don't know it
- Click [](https://bookstack.nsmbcentral.net/uploads/images/gallery/2024-04/Z1Gimage.png) ##### If you are on Windows -This still needs to be tested on Windows. This guide will be updated when steps have been made
You have now created a Debugger Target
#### Connecting to melonDS The **gdb interpreter** should have opened for you when you connected to the **debugging target.** -If you have lost the interpreter window, open the objects window (Window -> Debugger -> Objects) and click on [](https://bookstack.nsmbcentral.net/uploads/images/gallery/2024-04/WSwimage.png) to bring the menu back
- In melonDS, open your ROM. (You can either boot directly to the game or launch the firmware) Now, in the interpreter menu, run the command **target remote localhost:\[ARM9 Port\]** (Where \[ARM9 Port\] is the ARM9 Port set in the Devtools tab.) -By default, it should be 3333. The command would be **target remote localhost:3333**
If melonDS pauses after running this command, GDB is now talking to melonDS -If the connection immediately closes after running the command: change the ARM9 port to something else, restart melonDS, and close the current GDB connection.
You have now connected Ghidra to melonDS
#### Using Breakpoints If you would like to set breakpoints, you'll need to use the **Dynamic PC** 1. Open the **Dynamic PC** window by clicking **Window -> Listing -> Dynamic - Auto PC,** \[...\] 1.If you do not see this option, you can alternatively open it via **Window -> Debugger -> New Dynamic Listing**
2. Next, open the **Modules** window by clicking **Window -> Debugger -> Modules** 3. Lastly, click on [](https://bookstack.nsmbcentral.net/uploads/images/gallery/2024-04/BeZimage.png) in the **Modules** window. Now, setting a breakpoint in your code view should set a breakpoint in the **Dynamic PC** -Breakpoints will only update if the emulator has hit a breakpoint or has been paused by pressing [](https://bookstack.nsmbcentral.net/uploads/images/gallery/2024-04/ED1image.png)
You have now set up Ghidra to debug melonDS. Happy coding!