Using GDB with Ghidra and melonDS
What you'll need:
- The latest version of Ghidra
- A build of melonDS that has the GDB enabled
-
The easiest way to get this is to grab a GitHub action build of melonDS. You can find that here. (Note: you'll need to be signed into a GitHub account to download these builds)
- The GNU ARM Embedded Toolchain installed on your system
- A Ghidra database of NSMB DS
-
Eventually, NSMB Central will host a shared Ghidra project so we have one centralized project anyone can contribute to. For now, you can generate a Ghidra project using this tool. If you need help, please ask in our Discord!
Configuring melonDS
To enable the GDB, you need to do the following:
- Click on the Config menu at the top of the emulator, then click on Emu Settings
- Click on the Devtools tab
- Check Enable GDB stub
-
If you do not see the Devtools tab, then you have not built melonDS with GDB enabled. Please check the link at the start of the guide to find a download with GDB enabled or build it yourself enabling GDB in CMake
melonDS is ready to go!
Setting up Ghidra
To begin, open your Ghidra project in the code viewer as you normally would.
- Click on File -> Configure, which should open a list of tools
- Check the "Debugger" box
This should cause windows to appear in your current project, likely making the following steps redundant. If you are unable to find a window, the following steps will either open the window, or present it to you in the project.
Creating a Debugger Target
This method has been tested on Linux and macOS. You should be able to follow these steps using WSL on Windows. Follow this guide if you need help setting up WSL.
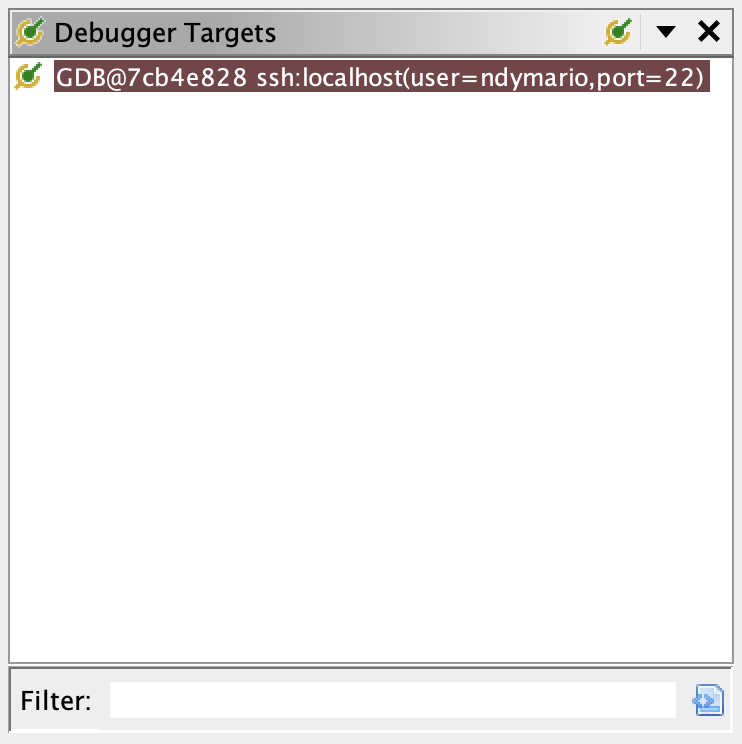
To begin, open the Debugger Targets window by navigating to Windows -> Debugger -> Debugger Targets.
The window should look something like this:
 As you'll notice, there is an active connection in the screenshot but nothing on your end...let's fix that!
If you are on Linux:
- Choose gdb in the dropdown
- Set arm-none-eabi-gdb -ex "set arch armv5t" as the GDB Launch Command
-
If you have not added arm-none-eabi-gdb to your PATH, you'll need to provide the absolute path
- Click

If you are on macOS
- Choose gdb via SSH in the dropdown
- Set arm-none-eabi-gdb -ex "set arch armv5t" as the GDB Launch Command
-
If you have not added arm-none-eabi-gdb to your PATH, you'll need to provide the absolute path
- Set SSH hostname to localhost
- Set SSH username to your username
-
You can use the command whoami in the terminal to get your username if you don't know it
- Click

If you are on Windows
-
This still needs to be tested on Windows. This guide will be updated when steps have been made
You have now created a Debugger Target
Connecting to melonDS
The gdb interpreter should have opened for you when you connected to the debugging target.
-
If you have lost the interpreter window, open the objects window (Window -> Debugger -> Objects) and click on
 to bring the menu back
 - In melonDS, open your ROM. (You can either boot directly to the game or launch the firmware)
Now, in the interpreter menu, run the command target remote localhost:[ARM9 Port] (Where [ARM9 Port] is the ARM9 Port set in the Devtools tab.)
-
By default, it should be 3333. The command would be target remote localhost:3333
If melonDS pauses after running this command, GDB is now talking to melonDS
-
If the connection immediately closes after running the command: change the ARM9 port to something else, restart melonDS, and close the current GDB connection.
You have now connected Ghidra to melonDS
Using Breakpoints
If you would like to set breakpoints, you'll need to use the Dynamic PC
- Open the Dynamic PC window by clicking Window -> Listing -> Dynamic - Auto PC, [...]
- Next, open the Modules window by clicking Window -> Debugger -> Modules
- Lastly, click on
 in the Modules window.
Now, setting a breakpoint in your code view should set a breakpoint in the Dynamic PC
You have now set up Ghidra to debug melonDS. Happy coding!

